

PERFORMANCE MEASUREMENT
What market-watchers and commentators refer to as a ?market? is in reality an amorphous concept and nothing more.
The stock market is, in essence, a collection of the quoted shares in a wide and disparate range of companies in any number of arenas. At any one point in time necessarily some of these shares will be rising whilst others will be static or falling in price.
Down the years a succession of indices has been created to try to give a summation of the mood of the ?market?.
Charles Dow created the Dow Jones Industrials and Dow Jones Transportation benchmarks in the late nineteenth century and while they were constructed to give each constituent share an equal impact, more recent thinking has resulted in the introduction of capitalisation-weighted indices.
In the UK, these encompass the FTSE All-Share, FTSE 250 and the bellwether FTSE 100.
The inherent problem with this approach is the index can be skewed by the price movements of a small subset of its constituents. In the particular case of the FTSE 100, Royal Dutch Shell (RDSB), HSBC (HSBA), Vodafone (VOD) and BP (BP.) make up nearly a quarter of the index.
Plot a path
Some charting programs such as Ionic?s ShareScope provide an option to plot several headline indices in either a capitalisation or non-capitalisation weighted basis.
A comparison of the two charts can be illuminating at times. An alternative approach is provided by the SIGnet index, a non-capitalisation weighted average of sector performance devised by the Serious Investor Group.
While a single index may lead to a simplistic view of any given market, most if not all relative performance is measured using these yardsticks, so they are important.
Stock selection may even be influenced as a consequence. Beta measures how much a stock typically moves in relation to a 1% change in the index, while the correlation between share price and the benchmark is measured by the coefficient rxy .
This can range in value from +1 for fully correlated pairs to -1 for a fully inverse correlation.
If an index is in decline, a high level of inverse correlation, between say -0.5 and -1, would pinpoint shares that are bucking the index and outperforming. As this is a linear calculation it is necessary to set a look-back period that is appropriate. Typically restricting the review of relative performance back no further than the last major turning point of the index would seem sensible.
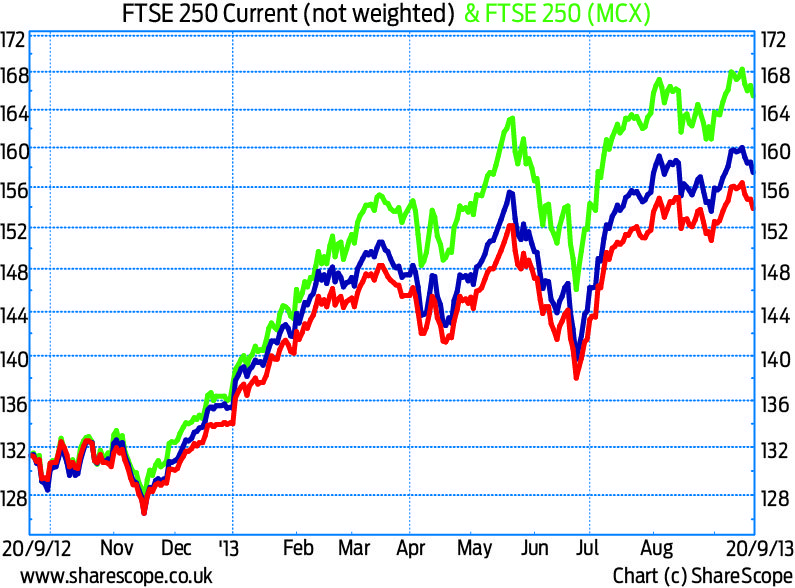
The red line shows the FTSE 250 without a capitalisation weighting, the blue line on an unweighted basis without investment trusts while the green represents the actual benchmark. The weighted approach seems to amplify the gains though this effect would also be expected to accentuate any declines.

The FTSE 100 index is plotted in red against a green line which portrays the performance of the SIGnet index since early 2000. The effects of how the FTSE 100 is so heavily slanted toward a relatively small number of mega-cap shares in a handful of sectors are very evident.


