

We would all like a crystal ball to pick future market winners and broker price targets are perhaps the closest we'll ever get to one. Issued alongside broker research, they are an attempt to predict the trajectory of a share price and offer a window into potential capital gains.
Sometimes a change in price target can lift a share price on its own, particularly if it comes from one of the larger investment banks. Some price targets are set at particularly hefty premiums - and this is often the case with resources exploration stocks.
An advantage of a price target is it offers a degree of precision that is not possible with a crude 'buy' or 'sell' recommendation. Working out at what level to put the price target is more than just a finger in the air exercise. They are usually based on some measure of intrinsic or relative value. The methodology used to derive them will depend on the relevant sector and maturity of the company.
Although a fair degree of analysis goes into price targets, these predictions have had at best a varying degree of success. A 2012 global study by the University of Waterloo and Boston College found the accuracy of target prices averages around 18% for a three-month horizon and 30% for a 12-month one. However, by understanding how a broker has arrived at their target you can draw your own conclusions about where the share price is headed and react accordingly.
Ultimate value driver
The absolute, or intrinsic value, of a company is usually established using a discounted cash flow (DCF) calculation. Cash flow is the ultimate driver of value.
DCF models are used to work out what the future cash flows of a company are worth in today's money, or their net present value (NPV).
It is a useful tool when looking at a company which is at the pre-revenue stage and is developing a long-term project. The four key elements that go towards making up a DCF are:
A basic operating free cash flow calculation (OpFcF).Establishing forecasts for OpFcF over a long-term period, perhaps the next 10 years.Determining the weighted average cost of capital (WACC). WACC calculates a firm's cost of capital where each category of capital, be it long-term bank debt, equity or bond financing is proportionately weighted.Discounting future OpFcF using the WACC to establish an intrinsic value for the equity.Value investors like DCF calculations because of the long-term horizons. The discipline required to build such a model also means an investor has asked a number of vital questions about the risks facing a business.
Alternative methodologies
For some companies, particularly miners and oil companies, it can be appropriate to use a NAV calculation to generate a price target. The NAV per share - also known as book value (BV) - is arrived at by dividing 'shareholder equity' in the balance sheet by the number of shares in issue.
Shareholder equity is total assets less total liabilities and is an expression of the net worth of a company. The future value of assets is usually calculated using a DCF.
The NAV can be divided into the share price to generate a P/NAV or 'price to book' ratio. Any figure below one suggests a firm is potentially cheap. This metric is often used when analysing mining and oil and gas companies as it gives a clear view of the price relative to the actual value of the firms' properties or assets.
If a company is trading at a discount to NAV then it could be oversold or undervalued. Although you may need to check the commodity price assumptions behind the NAV are credible.
A lot of brokers' note make a company's prospects look good by assuming commodity prices are going to be significantly higher than current levels.
Brokers typically produce a risked and unrisked NAV. The latter assumes all the company's projects are successfully executed while the former discounts the value of its assets based on the likelihood of success.
When a company is already generating profits and cash an analyst has the option of employing an earnings or cash flow-based metric to help them generate their price target. Often this will be used to determine if it is trading at a discount or premium to the average for its sector.
The simplest metric is the price/earnings (PE) ratio. This is calculated by dividing the share price by the forecast after-tax earnings per share (EPS) number.
In general terms the lower the PE, the cheaper the share - but initial appearances can be deceptive. Investors will gladly pay a higher multiple if a firm has high margins, good earnings visibility or is growing rapidly.
A PE could be low because earnings are about to reach a cyclical peak. In this case the stock could be a bad investment as a falling EPS tends to result in a falling share price.
Another benchmark used by analysts is enterprise value (EV). This is derived by adding a company's forecast debt and subtracting its forecast cash from the market capitalisation. This figure effectively tells you how much it would cost to acquire the firm.
It can then be used against a measure of earnings or cash generation to give a relative valuation. This includes the EV/EBITDA (earnings before interest, tax, depreciation or amortisation) and EV/OpFcF ratios - the latter of which can be used to come up with a free cash flow (FCF) yield.
Major weakness
All price target models have one major weakness: by simply tweaking the parameters and assumptions it is possible to change the end result (price target).
Research produced by a house broker needs particularly careful scrutiny. You can find out whether a broker is the appointed adviser to a company or merely independent either by looking at the investors relations section of a company's website or by checking the names that appear on the bottom of stock market announcements. A broker's name on such an announcement would mean they are the 'house' adviser.
Analysts can and will downgrade 'house' stocks if there is bad news, but they will always try and take the optimistic view as they are likely to want to keep their clients on board. The insider's view is that a broker with a 'hold' rating on a 'house' stock really means 'sell'.
GoldBridges Global Resources (GBGR)
Current share price: 1.68p
Target price: 5p
Implied upside: 198%

Stockbroker Cantor Fitzgerald published a detailed research note on Kazakhstan-based miner GoldBridges Global Resources on 30 November 2015.
It declared a 5p price target, implying the share price has nearly 200% upside. That appears very attractive for investors, but it is worth a closer look to understand how the target has been obtained before you rush to buy the shares.
Cantor has analysed the business both relative to the market and on absolute terms. Target prices normally apply to a 12-month forward period. With GoldBridges, the broker has looked at financial multiples from 2017 as this reflects the point at which it should increase gold production to 100,000 ounces a year.
For the relative valuation, the broker uses a six metric-based approach for 20 gold producers listed on the London market including enterprise value to ounces produced, and price to cash flow. It applies $1,250 per ounce gold and $19 per ounce silver prices which are considerably higher than current precious metal prices.
The average valuation for GoldBridges based on this broader market view is $119.1 million which equates to 5.1p per share. At spot metal prices at the time of the research note (30 Nov 2015), this drops to 4.5p per share.
For absolute value, it looks at the Sekisovskoye underground development that is central to GoldBridges' expansion plan and calculates net present value (NPV). This is working out the potential revenue from the project if all the known gold was extracted - then deduct cost of construction, operating the mine, royalties, tax and applying an overall 15% discount rate to reflect the risk associated with the project. This equates to $179.2 million or 5p per share.
If you run the calculation using spot prices from late November 2015 and the same 15% discount rate, the NPV equates to $124.1 million or 3.5p per share. That implies the share price could still double from current levels even at the most conservative end of valuation methods.
Investors must also consider market sentiment towards the gold sector which is presently negative. A good stock will struggle to rise in a bad sector; whereas a bad stock can easily rise in a good sector. GoldBridges may eventually turn out to be a great investment from current levels; investors simply need to expect extreme volatility in the share price until sentiment improves towards gold mining equities.
Falcon Oil & Gas (FOG:AIM)
Current share price: 5.62p
Target price: 19p
Implied upside: 238%
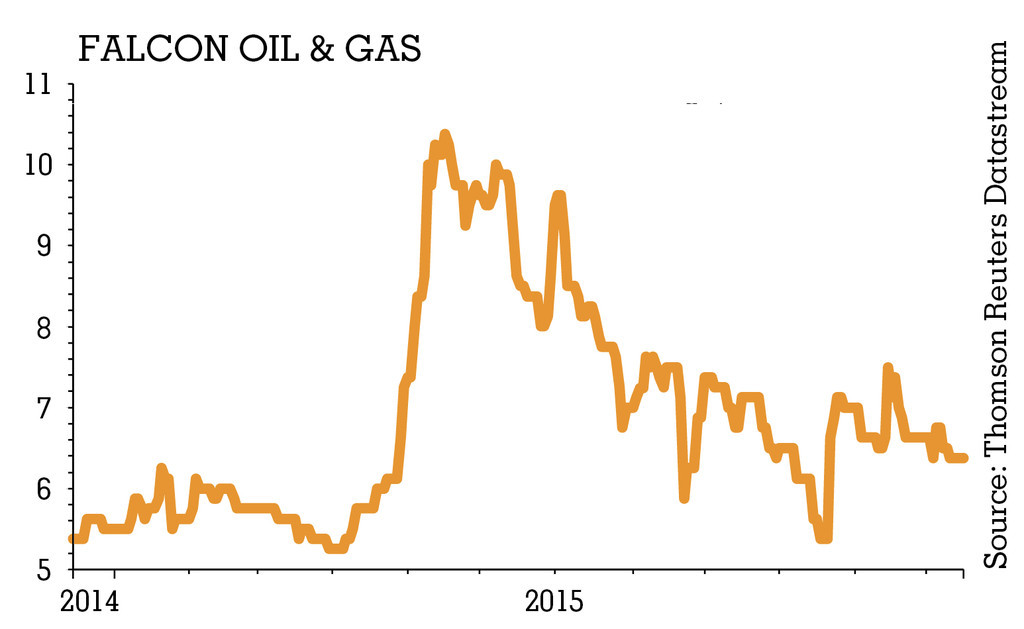
Completion of a farm-out on Falcon Oil & Gas' Australian Beetaloo asset in August 2014 saw Origin and Sasol take 70% of the project. In return Falcon received A$20 million in cash and is now carried on a comprehensive exploration programme worth at least A$165 million. This includes the drilling of nine wells. Falcon is fully carried on the first five wells - estimated at A$64 million - with no cap. It is carried up to a cap of A$101 million on the next four wells.
The first three wells of this programme were drilled in 2015. Two vertical wells - Kalala S-1 and Amungee NW-1 - were sufficiently successful that the Amungee NW-1H horizontal well was brought forward from the fourth quarter of 2016 to 2015.
Operations on this latter well completed in November 2015 and the results were described as encouraging. Fracking on the well - planned for 2016 - should give a better indication of whether the targeted resources can be commercially developed.
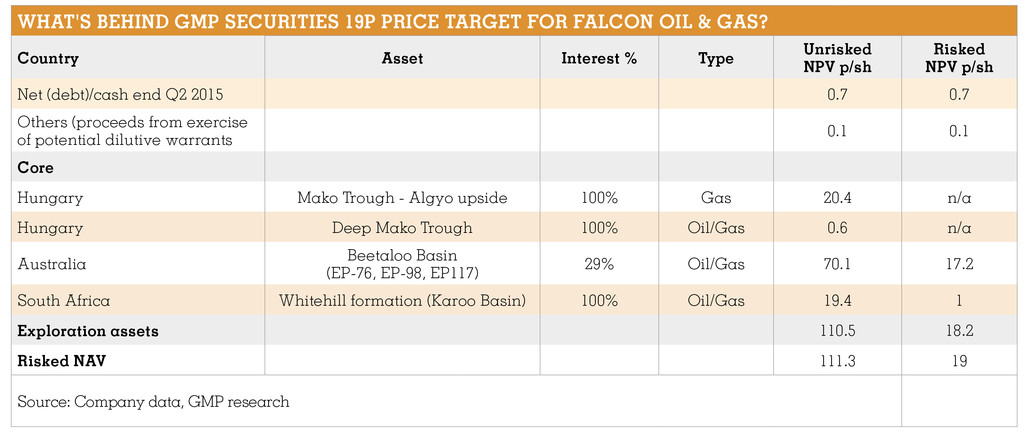
In order to value the company's unconventional portfolio - it also has projects in South Africa and Hungary - Canadian broker GMP Securities uses a dollar-per-acre approach. This is based on historical transactions related to early stage unconventional projects.
Valuations start from $40 per acre during the 'trends' stage, according to GMP. This is where a company has seismic data, understanding of regional geology and information from previous drilling. Valuations can exceed $800 per acre for 'undeveloped' acreage (seismic, well data, oil and gas shows and flow tests) and upwards of $4,000 per acre for 'appraisal' stage assets (successful flow test, production from vertical/horizontal assets with or without fracking).
Using this methodology GMP ascribes $40 per acre to the Hungarian and South African assets and $800 per acre to the Beetaloo project. Investors need to consider if these historic valuations could be achieved in the current commodity price environment. The table (click to enlarge) shows how the resulting net asset value feeds into its bullish 19p price target.
Undervalued relative to near-term prospects?
Petra Diamonds
Trades at 87.75p.
Numis has 145p price target.
Implied upside: 65.2%
Sirius Minerals
Trades at 14.5p.
Liberum has 38p price target.
Implied upside: 162%
Cluff Natural Resources
Trades at 3p.
Panmure Gordon has 10p price target.
Implied upside: 233%


