STOP LOSSES
The tendency to let positions ride a little longer than is wise in the vain hope that they will ?come good? means that all too often what starts out as a small loss rapidly develops into a much larger one. Panic sets in and the trader freezes as the situation steadily deteriorates.
Stop losses can help short-circuit emotion and thereby systemise trading at a tactical level.
Stops can be of two basic types, static or trailing. The former needs to be constantly reviewed and amended. Ideally such stops are moved quickly toward the trade instigation price so as to achieve a break-even situation should the stop then be hit. The trade is then ?free riding? and the emotional stress of keeping it open will be considerably lessened.
In contrast a trailing stop will shadow price action and be automatically updated at the conclusion of each trading session and if the market has moved in the direction of the trade it will invariably also move. All stops, trailing or static, should only move in the direction of the trade (i.e. up for long trades and down for short trades).
Reverse engineered
Technically driven trades may well originate from daily or even longer-term charts.
To minimise risk, ideally the trade is taken at the most advantageous intra-day price level. This necessitates observing the market during the session by following the (daily) bar on which the signal has been given and trying to fine tune entry when the intra-day ebb and flow moves against the proposed trade. This permits a close stop and therefore minimises possible losses.
If such fine tuning isn?t possible then the most basic approach is to consider the low of the signal bar (in the case of a long trade) or the high (for a short trade) as being a level that should not be breached when the position is subsequently opened.
A variation of this thinking might be to set a given number of points beyond these previous bar extremes or to set a stop equivalent to the price extreme seen over the last few bars.
On daily bars, where five bars equate to a trading week, some like to use the high and low for the last five bars as a starting point for their stop.
If a market has been signalled as a potential trade then of course a technical measure of some kind has been given. If this has resulted from an indicator-based signal then it is possible to turn the indicator mathematics around and discover the price needed to cancel out that signal or give an opposing signal. This too can form the basis of a stop system.
For example, the maths of the MACD indicator can be reverse engineered to see what price would be needed to push the line above or below zero or to cause the indicator line to move through its signal line.
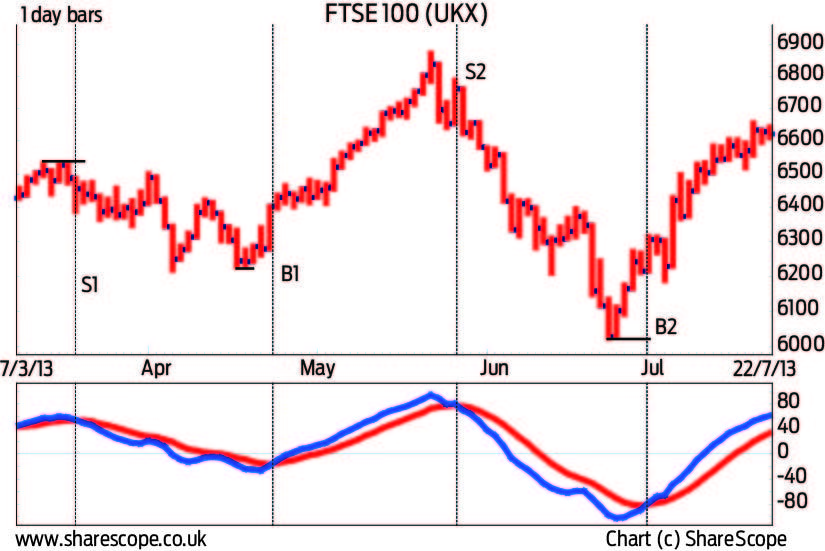
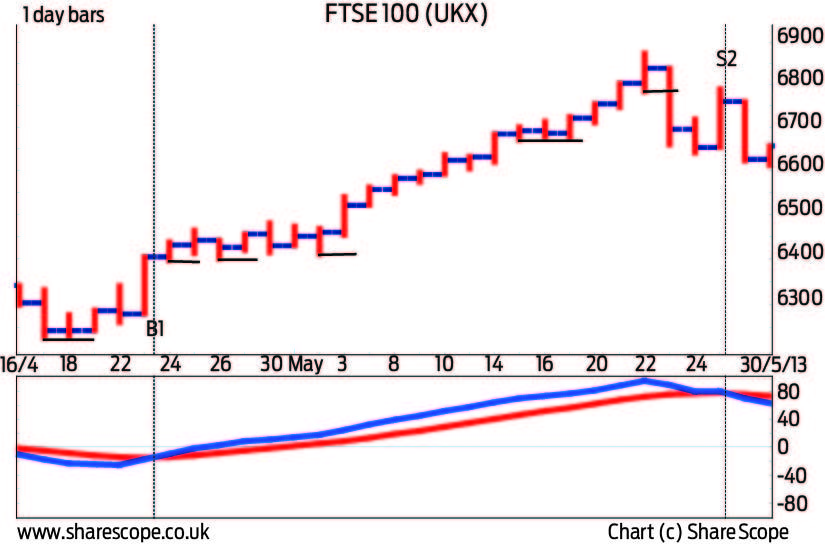
The initial stop for each indicator-generated signal might have been taken as the extreme of the price bar on which the signal was given. However in the case of S1 and B2 this could have resulted in losing trades. A line has been marked on the chart showing the price extreme seen in the preceding five bars, an alternative ?basic? stop approach.