
Macro-economic releases have the capacity to move markets and all investors should have a grasp of what is going on in both the global and domestic economy To demonstrate the impact they can have we look at how two major announcements moved the Dow Jones Industrial Average in September 2014. Risk-tolerant investors with a near-term time frame looking to play future updates across the Atlantic could consider gaining short and long-term exposure to US shares through Boost US Large Cap 3x Short Daily (3USS) and Boost US Large Cap 3x Leverage Daily (3USL).
Dismal science
Economists, as the old joke goes, have predicted nine out of the last five recessions. Yet despite a wave of scepticism spurred primarily by the financial crisis, the ?dismal science? has made some significant improvements to our understanding of the complex interactions that make up a modern economy.
Things have moved a long way since the 1920s, when investors had to rely on quirky data points like pig iron production to gauge the health of the economy. So, what are the key economic indicators in the UK, how should they be interpreted and how, if at all should they guide investment strategy?
Leading indicators are usually the place to start for investors, because they attempt to provide an estimate of economic activity in the future. This is, of course, the period of most relevance to the stock market because it is a discounting mechanism for future earnings.
A leading indicator is distinguished from a lagging indicator simply in terms of the period the data refers to. For example, business surveys are among the most effective predictors of future economic performance, according to Samuel Tombs, chief UK economist at London-based Capital Economics. Unemployment data is an example of a lagging indicator, because hiring decisions are typically made some time before an employee appears on the payroll.
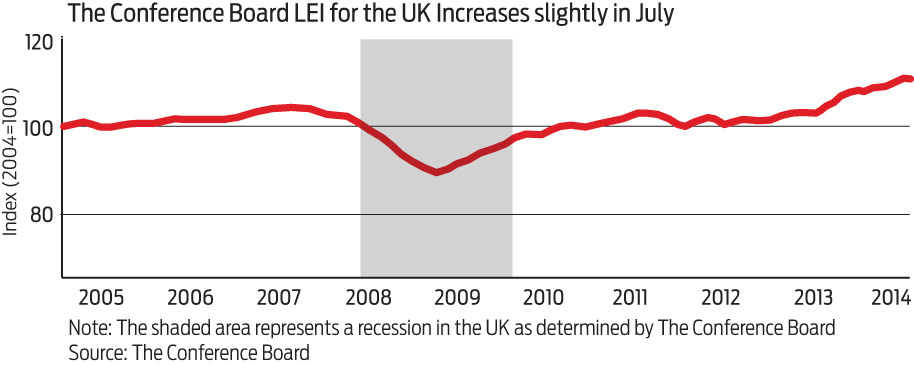
One of the more widely followed leading indicator series is the Conference Board Leading Economic Index (LEI). The Conference Board is a New York-based research association which publishes leading economic data series for the world?s largest economies on a monthly basis.
What is interesting about the data points used here is that they tend to receive less attention than, for example, GDP figures in general media coverage. But they may do a better job of indicating how the economy is performing in the current quarter and some way ahead of that. Most of the other indicators are fairly self-explanatory but some require a little more explanation.
Yield spreads are becoming an increasingly popular inclusion in leading index series because of their recent strike rate of predicting recessions. Typically the spread is measured as the difference in yield between a country?s 10-year government bond and its three month paper. When the 10-year yield is higher than shorter term rates (the yield spread is positive) it indicates financial markets are functioning normally: lenders are willing to receive lower rates in the short term than they would for putting money to work longer term.
Occasionally, short term rates rise above 10-year yields, causing a situation called an ?inverted? yield curve (the yield spread is negative). This happened in early 2008 and in the economic slowdown of the early 2000s. In fact, an inverted yield curve has predicted each of the last seven recessions in the US, most of which coincide with downturns in the UK economy and stock market. There was no UK recession in the early 2000s, but the stock market tumbled regardless.
While this indicator has gained a great deal of credibility in recent decades because of its success rate, it was less effective in forecasting recessions in the 1950s, the last time real and nominal interest rates were at record lows. This highlights that, while data can help give us a rough idea of where the economy is heading, uncertainty is a core feature of the economics and financial markets.
LEADING INDICATORS, AS USED BY THE CONFERENCE BOARD (UK)
- Order books: The Confederation of British Industries (CBI) surveys firms about output levels over the last three months
- Volume of expected output: A CBI survey of firms? expectations for output in the next three months
- UK consumer confidence: There are a number of consumer confidence measures; the one used here is the European Commission?s monthly survey
- FTSE All-Share Index: Performance of the stock market (FTSE)
- Yield spreads: Difference between interest rates on long and short-term government bonds (Bank of England)
- Productivity: Real (inflation-adjusted) economic output produced by a unit of labour input (Office for National Statistics, ONS)
- Gross operating surplus of corporations: Profitability of UK non-financial corporations (ONS)
Another caveat about placing too much weight on leading indicators is the inclusion in many of the FTSE All Share index. Improvements in the Conference Board?s LEI caused by changes in the stock market clearly cannot then be used as a basis to invest in the stock market
What do leading indicators tell us currently about the state of the UK economic recovery? The most recently released Conference Board data shows a 0.1% increase in the series in July, after 0.6% and 0.5% increases in June and May, respectively.
?The Leading Economic Index for the UK increased only slightly in July amid weakening production expectations, consumer confidence and stock markets,? says Ataman Ozyildirim, director for business cycle and growth research at the Conference Board.
?Although the six month growth rate of the LEI still points to expansion that will be stronger than in continental Europe, rising tensions in Eastern Europe and persistent deflation in the Euro Area pose increasing uncertainty and risks to the UK economy.?
Stop-start recovery
The UK economy is clearly growing out of an unusually severe recession and a temporary blip at the start of the government?s austerity campaign, which began in 2010. Six years on from the financial crisis, Tombs at Capital Economics says it is hard to say where in the cycle the UK economy is because of the stop-start nature of the recovery.
?On the basis of the economic indicators we follow, it looks like an early to mid-cycle economy,? he says. ?I think generally that if productivity recovers it should alleviate the strain on business profit margins we have seen recently. The productivity puzzle has meant we haven?t seen profits recover as much as we might have in previous recoveries and that may explain some of the underperformance of the UK stock market over the first part of the year.?
An early to mid-cycle economy would imply a preference for technology and industrial stocks, according to research conducted by Fidelity investments, which measured the relative returns of stocks throughout different stages of the business cycle in the US.
A number of institutional investors, including hedge funds, use these types of forecast, as well as their own proprietary macro research, to guide investment policy, a process called tactical asset allocation. As well as shifting between stock market sectors, these funds will also shift asset allocations between stocks, bonds, commodities, cash and alternative investments depending on their view of the likely path the economy will take. The success or otherwise of this method is somewhat unclear and it is generally considered that market timing is a near-impossible task. While tactical asset allocation is a more sophisticated version of market timing, it is market timing nonetheless.
For adventurous investors who have the time to do their research and are willing to back their judgement, there may be some value in building economic data into their investment process. Over long periods, a buy-and-hold strategy which feeds money into the market gradually has delivered reasonable long term results. As the old saying goes, ?it?s time in the market, not timing the market?.
Making a fast buck
As well as guiding long term investment strategy, macro announcements can reap profits for short term traders who believe they have an edge over the market consensus and other investors.
Non-farm payrolls and the Federal Open Market Committee (FOMC) statement on interest rates were both market moving events in recent weeks in the US. Traders who got in before these announcements and made bullish bets will have had a good month so far, as both announcements sent markets higher.
Non-farm payrolls is one of the most widely followed data points for more short-term stock market traders. The S&P composite index and the Dow Jones Industrial Average regularly show volatility around announcement of the figures, which are published at 8.30 am New York time on the first Friday of each month by the US Bureau of Labor Statistics. The latest edition, released on September 5, which references the month of August, showed total nonfarm payroll employment increased 142,000 against analyst consensus of 180,000. The previously reported numbers for June and July were also revised down.
(Click on table to enlarge)

But a trader who thought worse-than-expected numbers would lead to the market falling would have been wrong. The Dow Jones and gold rallied while the dollar fell on the news. In a sign of the current unusual market environment, investors have for the last few years considered bad economic news to be good for the stock market. When economic data is poor, it increases the likelihood that the Federal Reserve will keep monetary policy looser for longer. Low interest rates and easy liquidity boosts stocks and bonds but tends to weaken the dollar.
(Click on chart to enlarge)
The FOMC report, published at 2.00 pm on September 17 in New York, stressed the Federal Reserve will leave interest rates unchanged for a ?considerable time? after the end of its quantitative easing programme. The Dow Jones index rose slightly on the statement and then rallied further after Janet Yellen?s press conference at 2.30 pm. However, longer term bonds fell and the dollar rose slightly as FOMC members increased their forecasts for how quickly rates would rise after the first increase.